Lately, I’ve been diving into personal finance and thinking about how to make analysing my spending habits more insightful—and less overwhelming. As someone with a background in UX and frontend, I wanted to prototype an AI-powered system that could take raw transaction data, uncover meaningful patterns, and present it visually in a way that’s actually useful. After researching online, I found some great resources that helped me get started and I thought I’d share my experience with you.
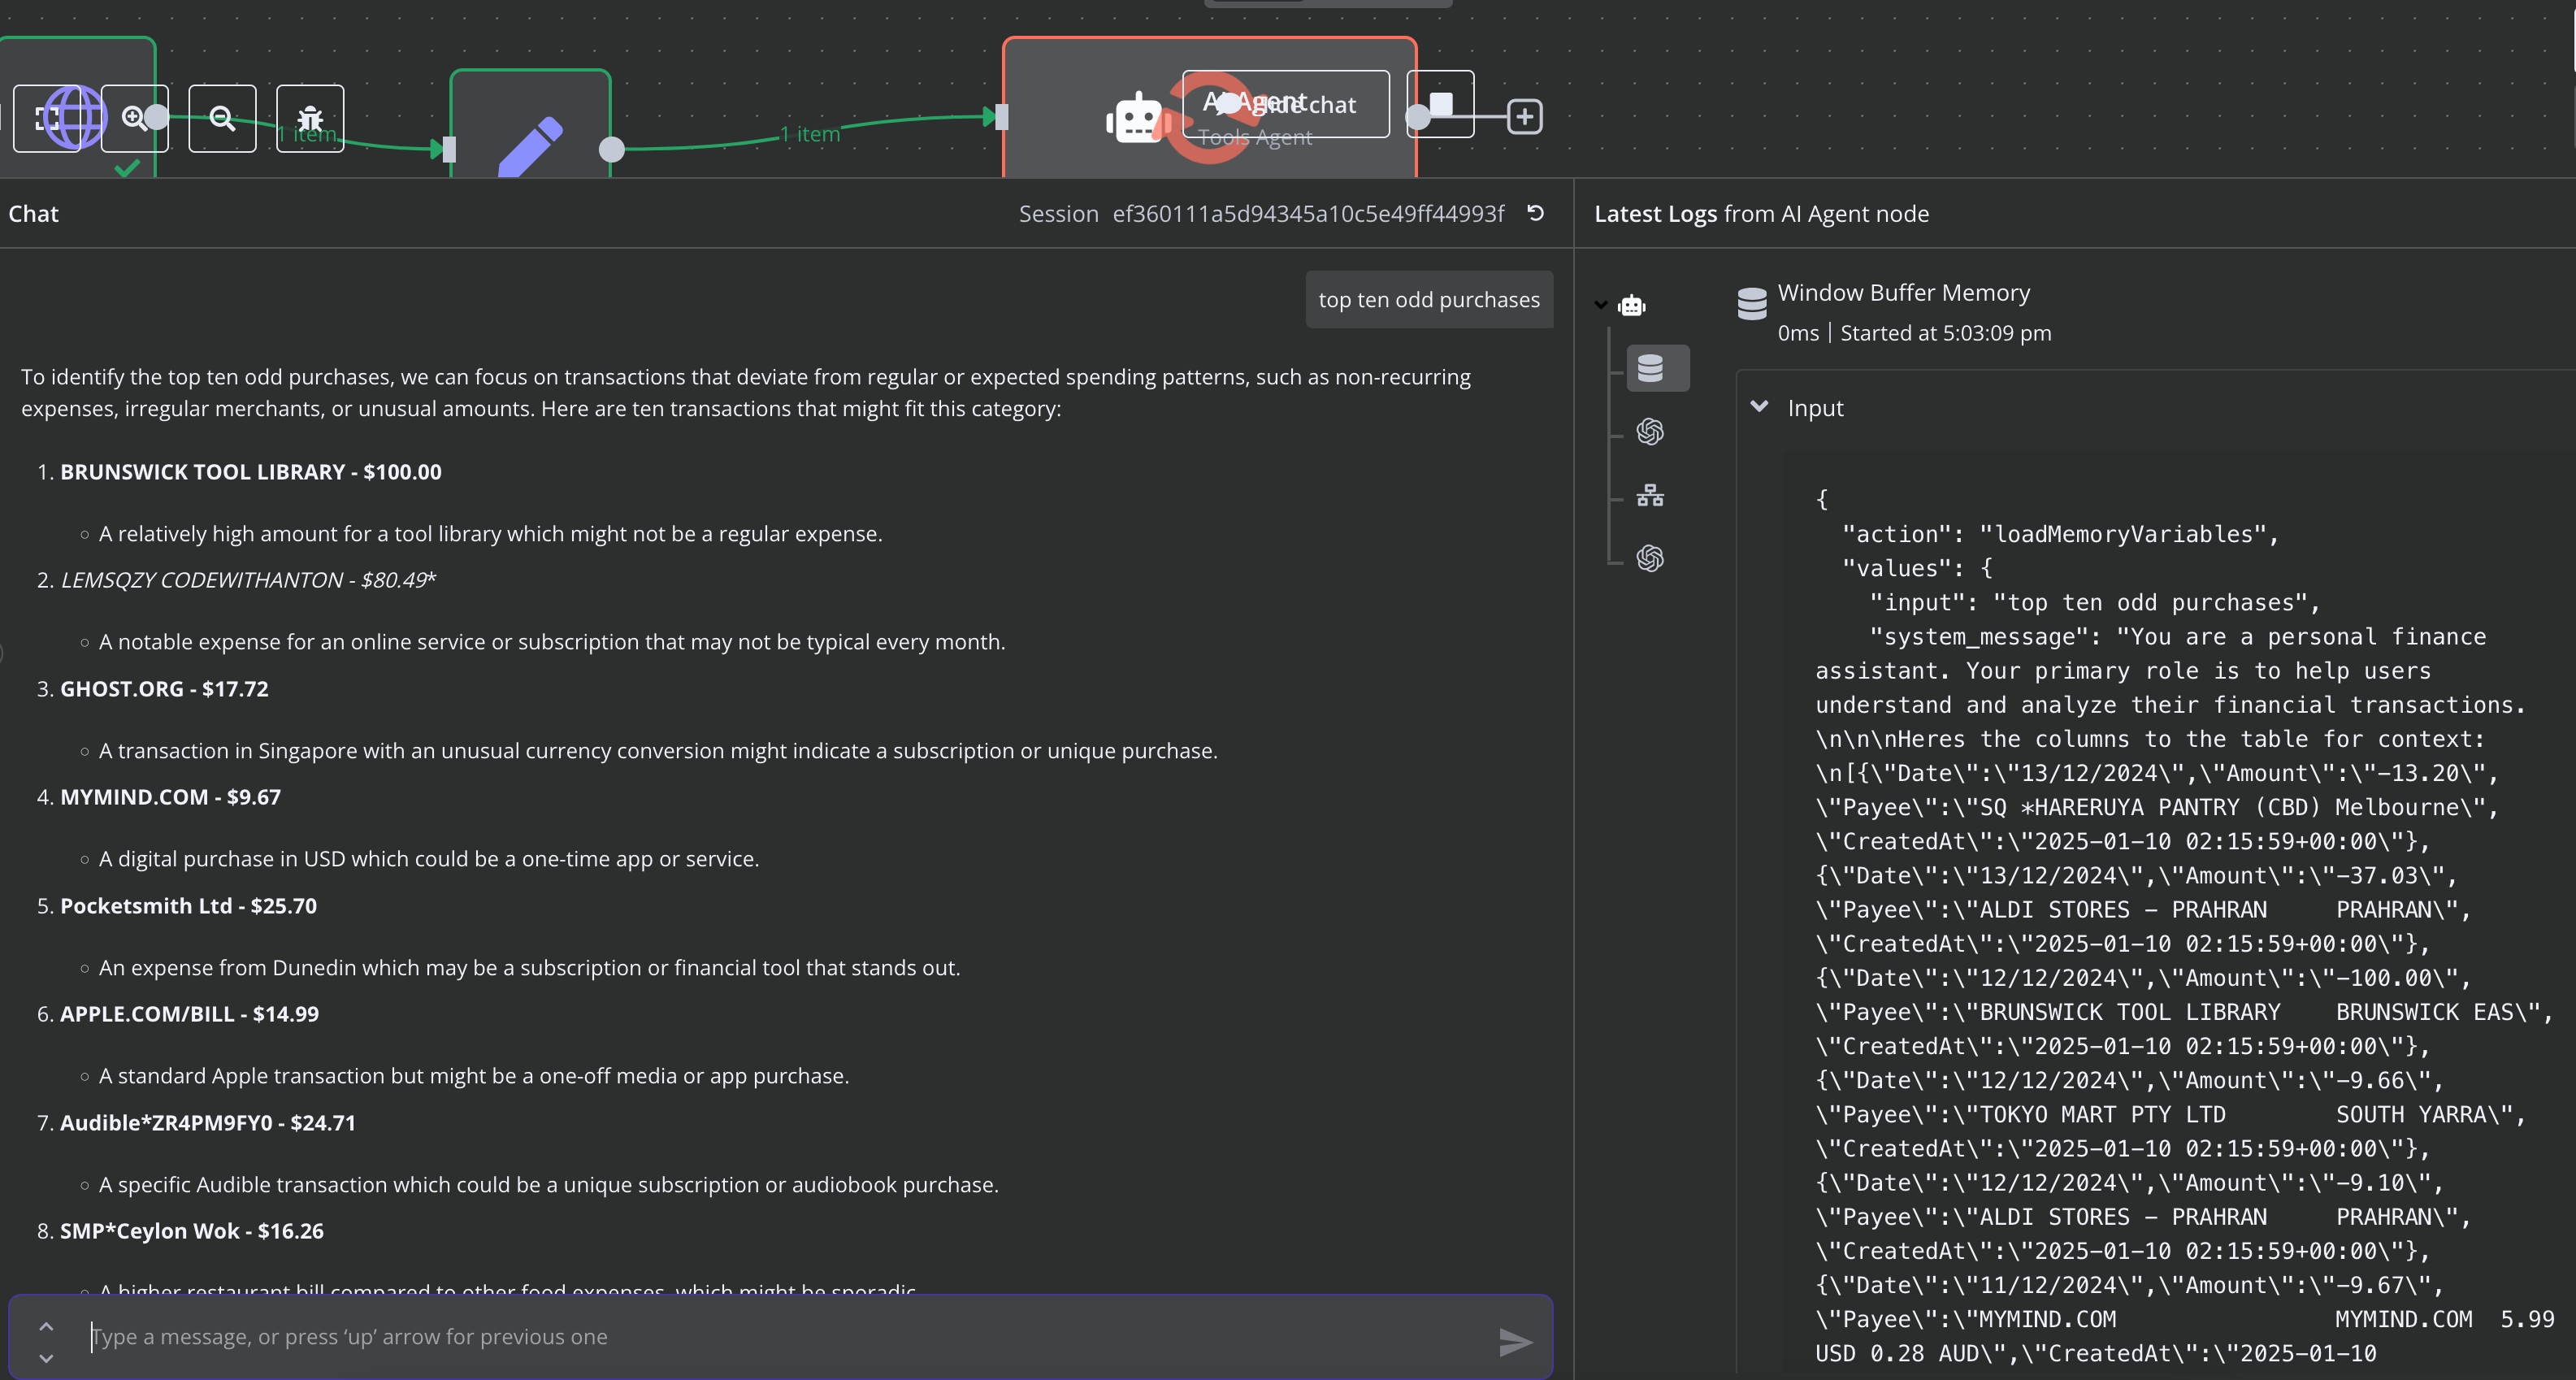
One of the most interesting aspects of this project was implementing anomaly detection in spending patterns. The system can identify unusual transactions or spending spikes that might need attention.
What I Built
With n8n, NoCoDB, and QuickChart, I built a workflow that can:
- Analyse transaction data for trends, anomalies, and categories
- Create visualisations like charts and graphs based on the data
- Generate detailed reports based on natural-language queries
- Turn tedious data analysis into something seamless and accessible
Here’s how I did it and what I learned along the way.
The Tools: Automation Meets Personal Finance
To bring this project to life, I relied on the following tools:
- NoCoDB: To structure my financial data in a database
- n8n: To automate workflows and integrate tools like AI and QuickChart
- QuickChart API: For generating clean, customisable visualisations
- OpenAI (GPT-4o): To answer natural-language queries and generate insights from my data
Building the Workflow
1. Organising the Data with NoCoDB
I started by exporting my financial transactions (as a CSV file) and importing them into NoCoDB. This tool turned my spreadsheet into a relational database, making it easier to query and manipulate.
Here’s a snapshot of the database structure after uploading:
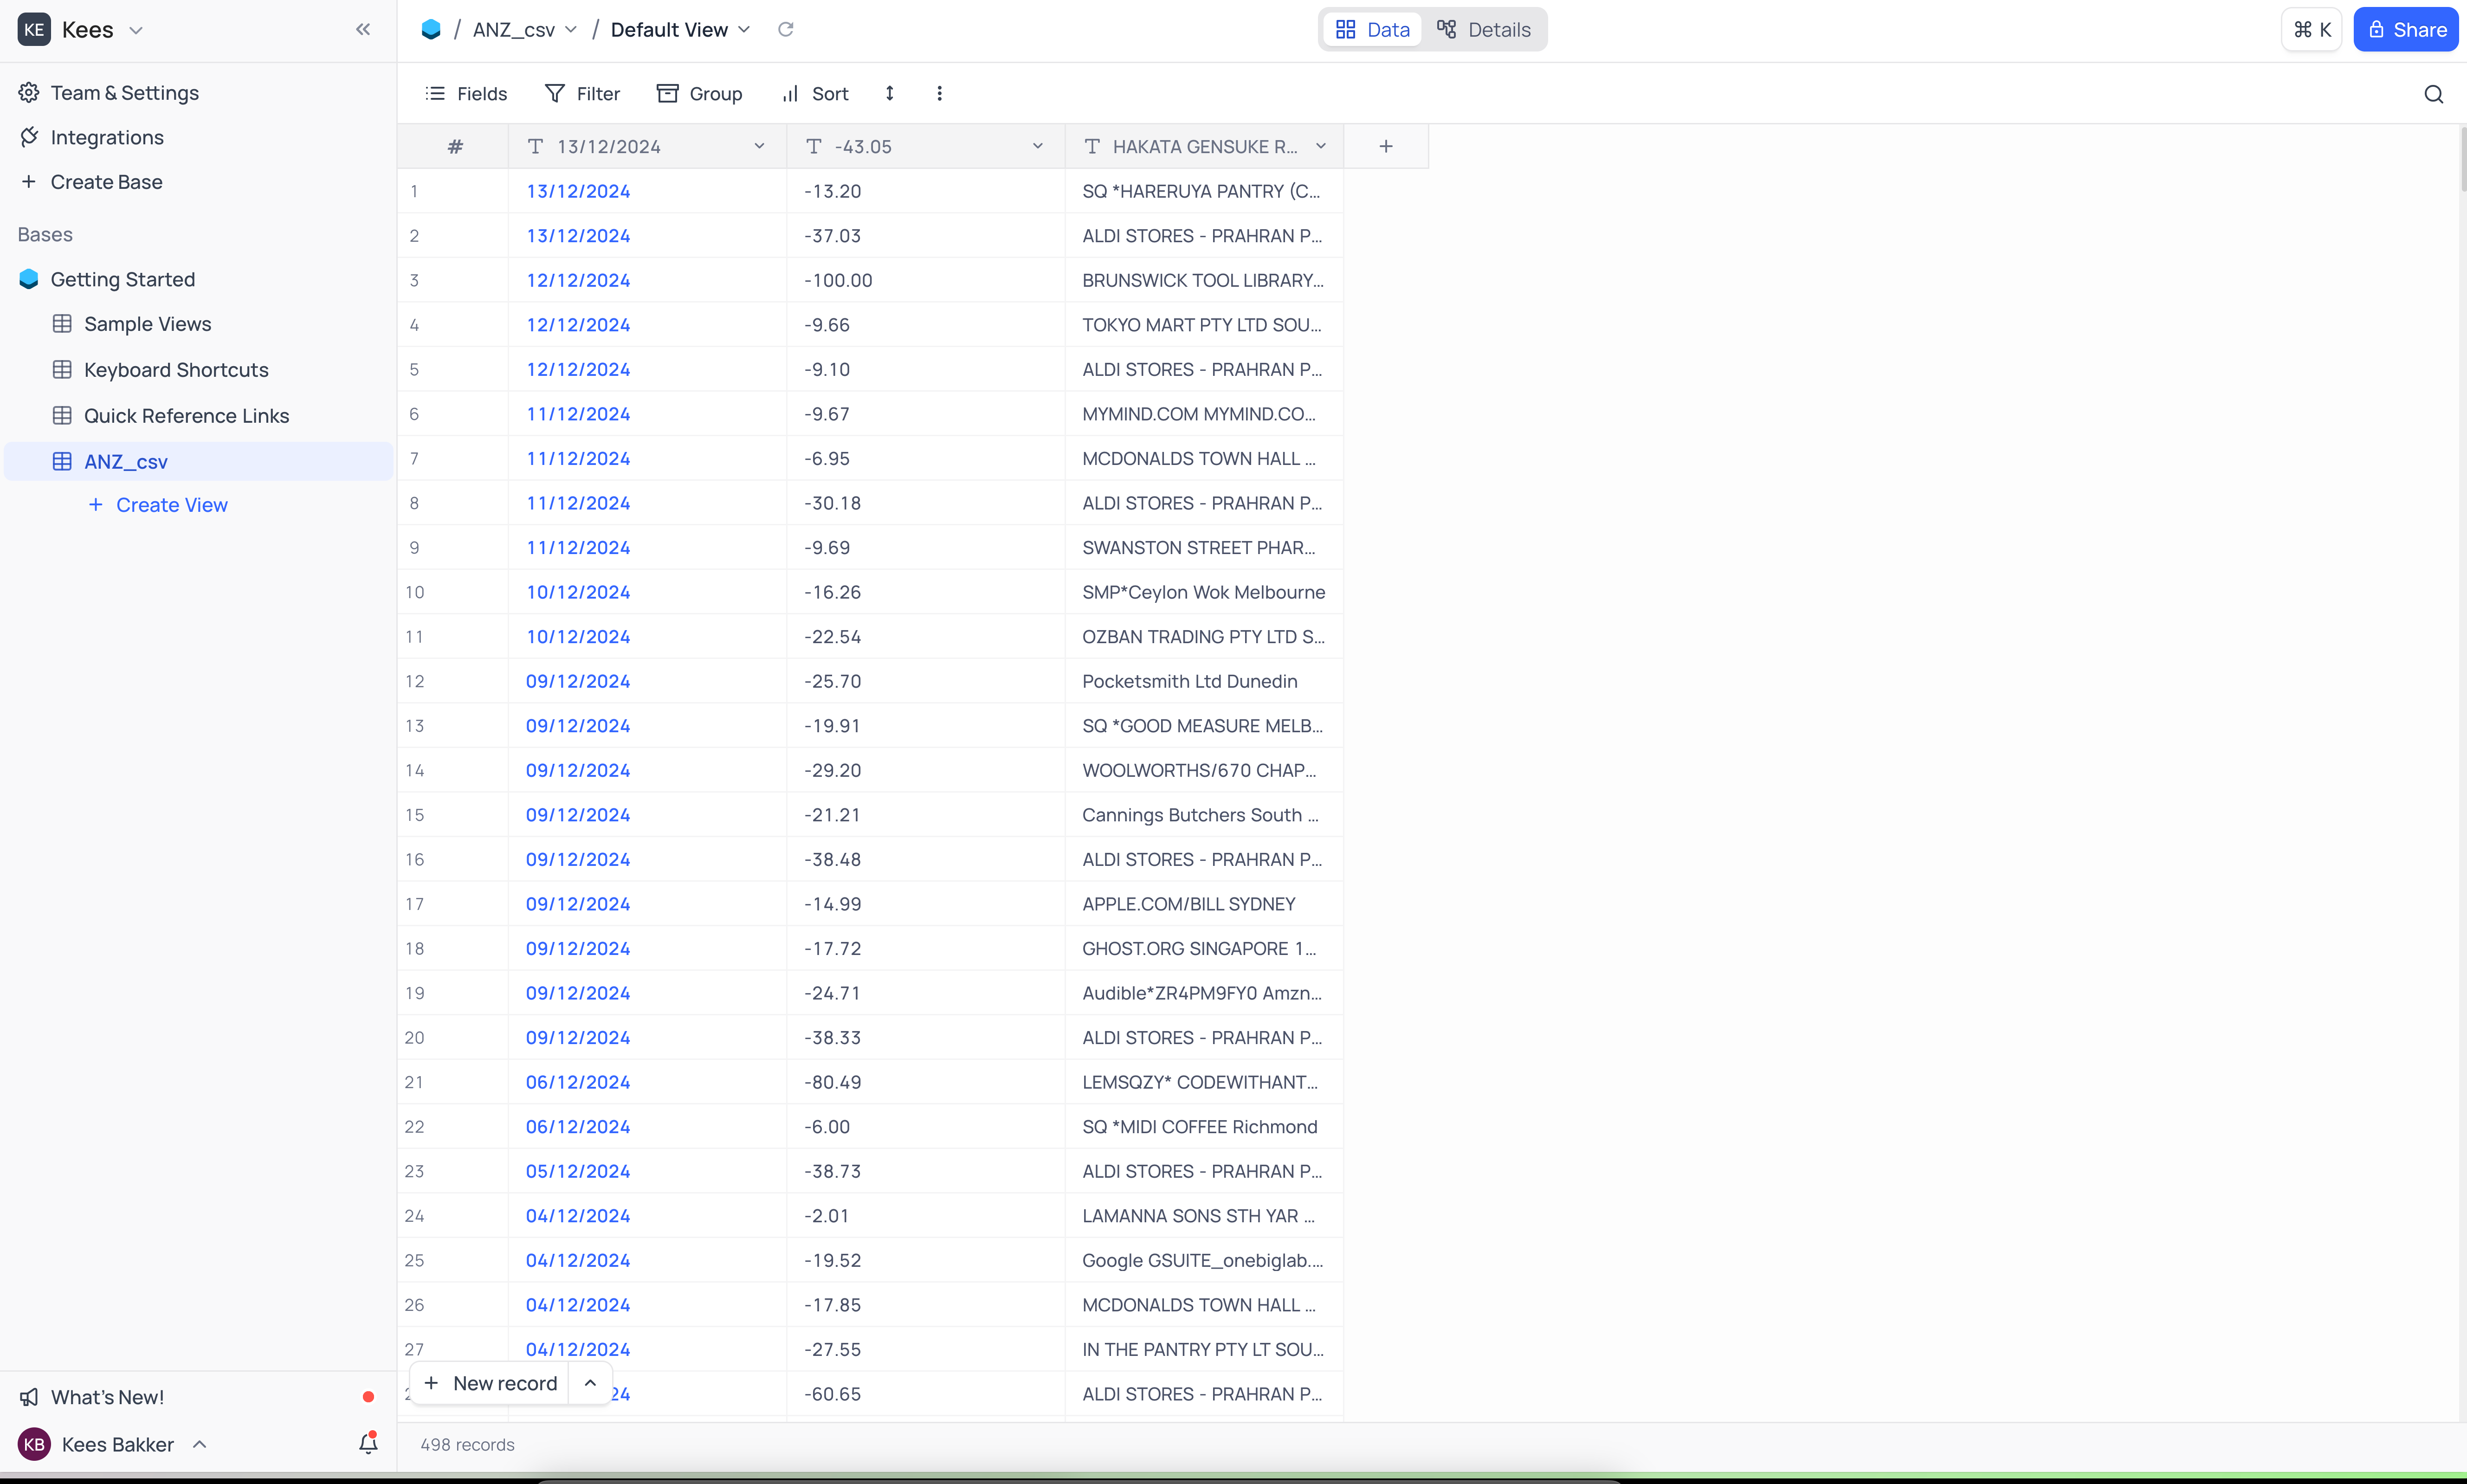
Each transaction is categorised by columns like Date, Amount, and Payee. Having a clean structure made querying a breeze.
2. Creating Workflows in n8n
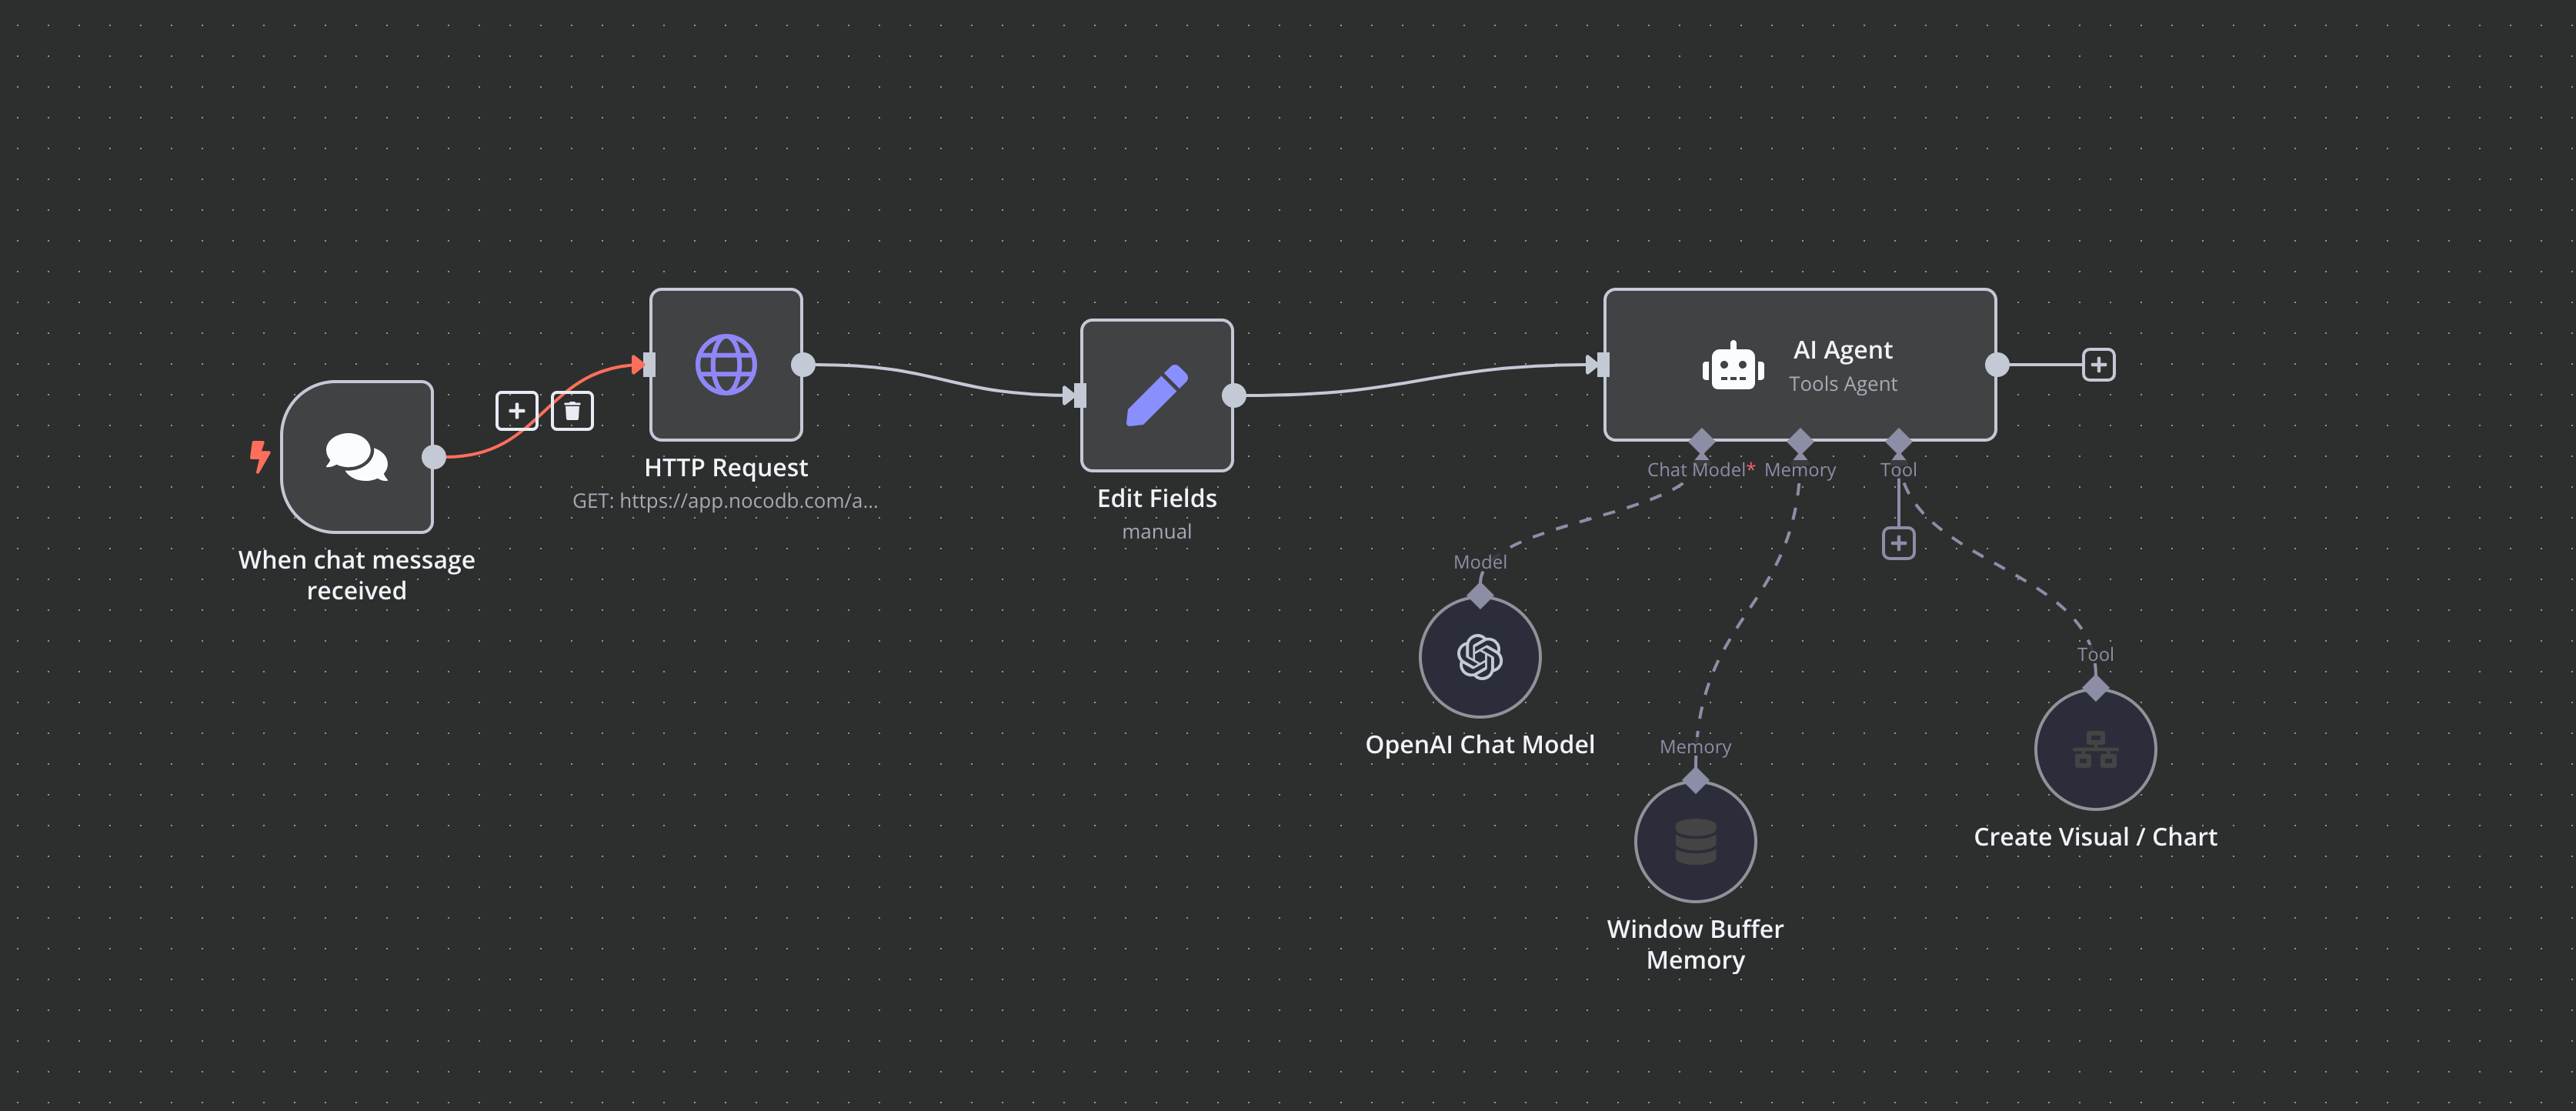
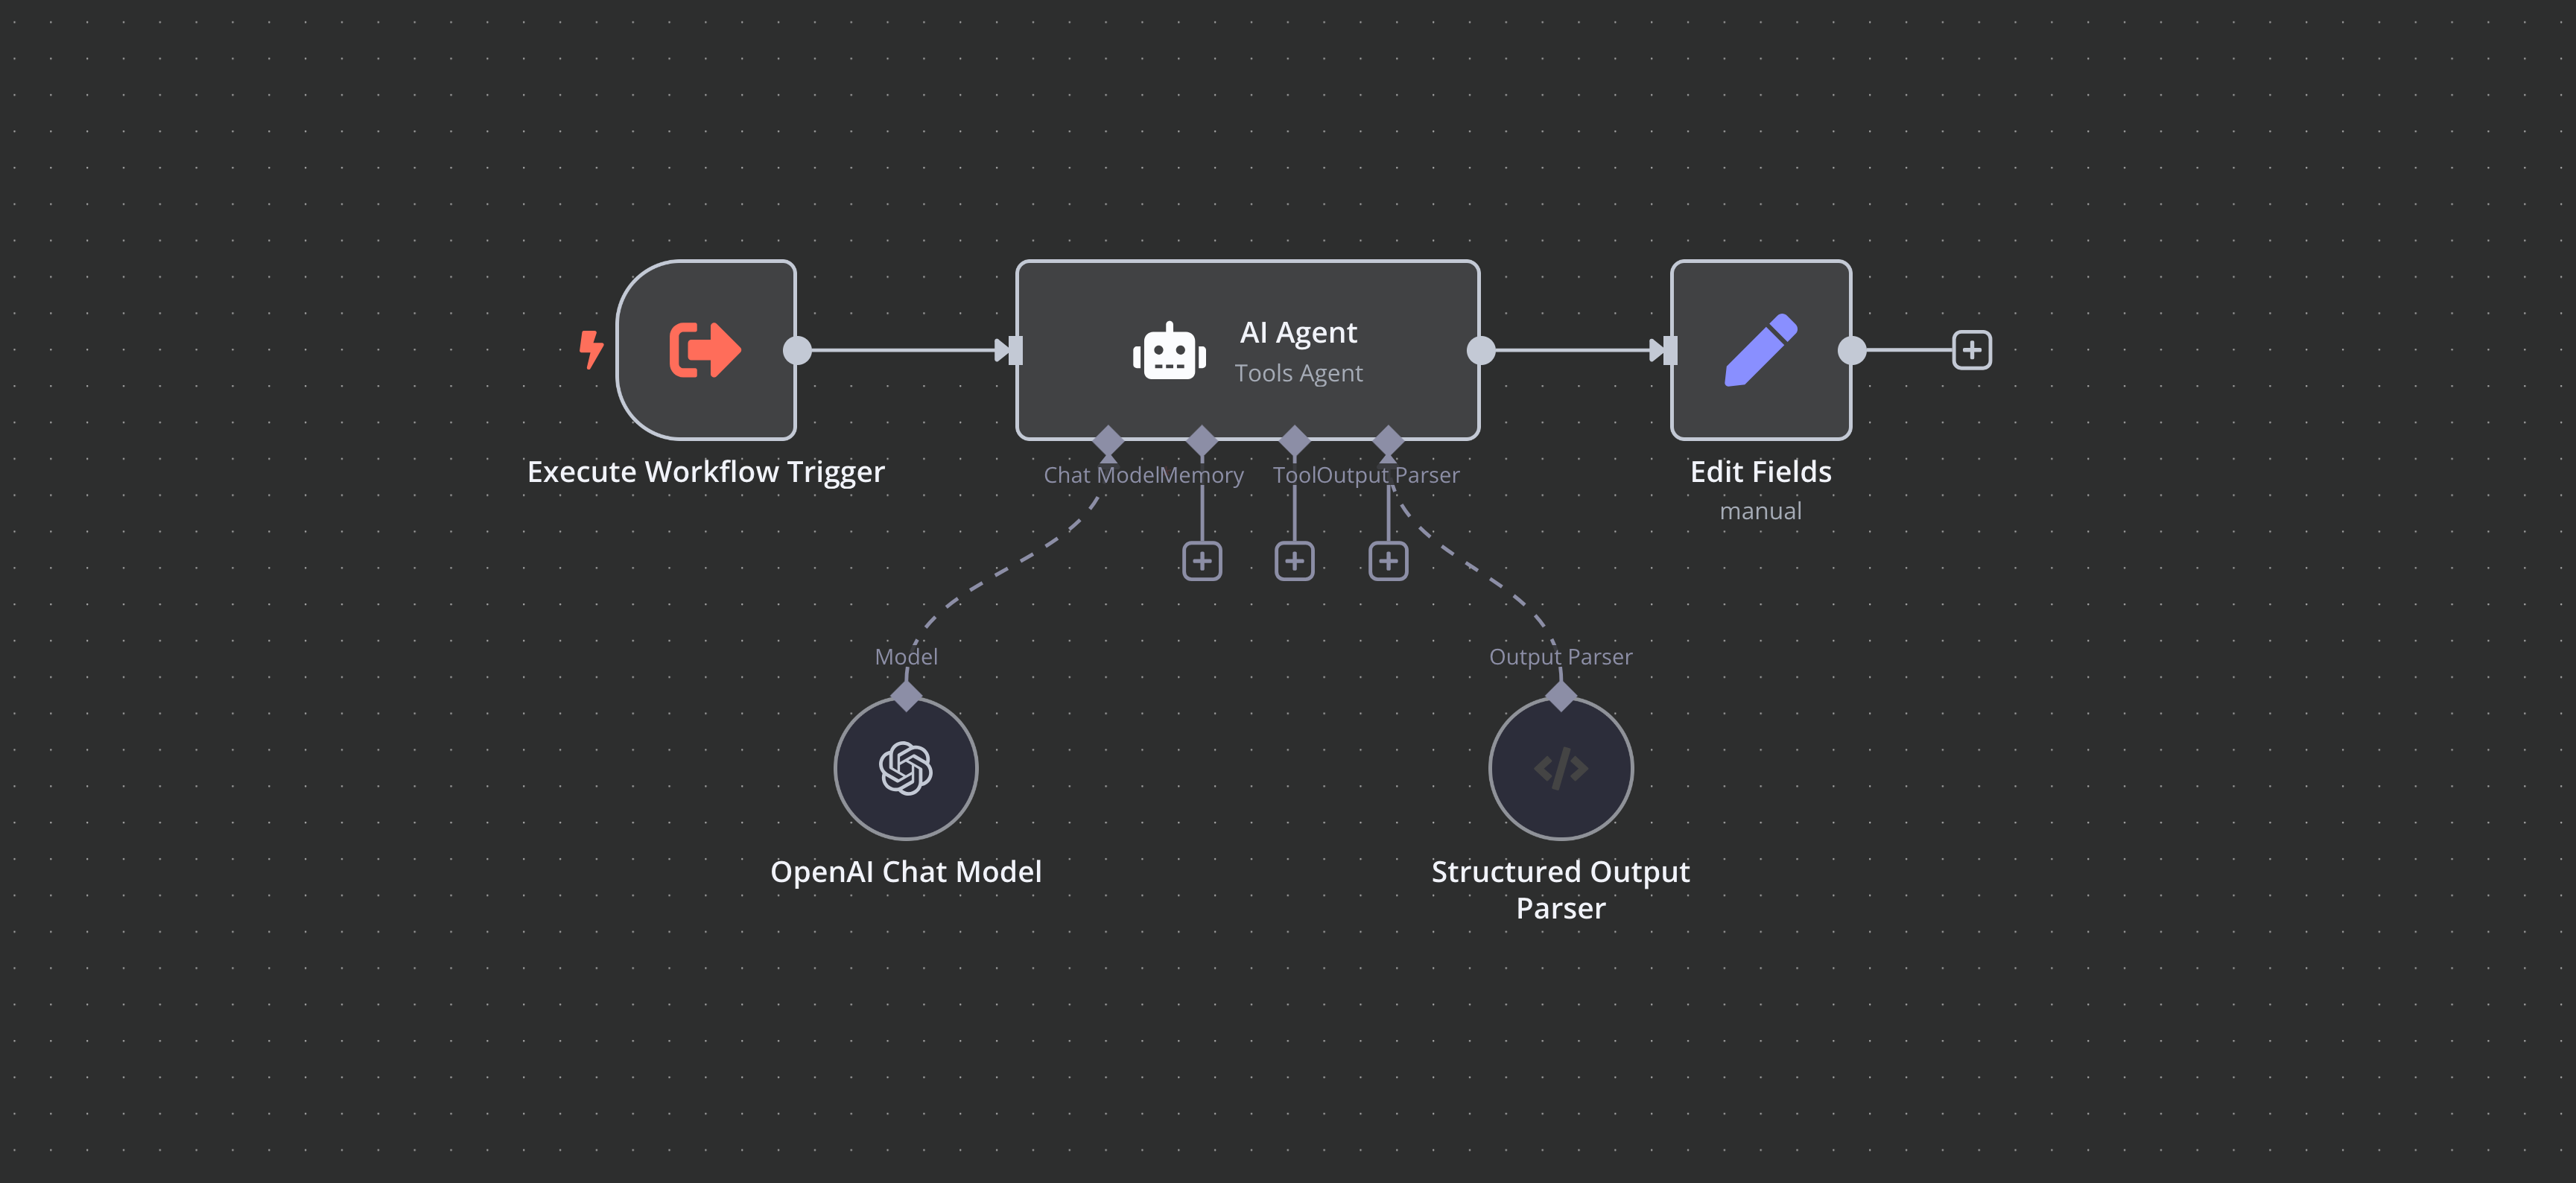
With the data organised, I turned to n8n to automate the workflow. Here’s what my process looked like:
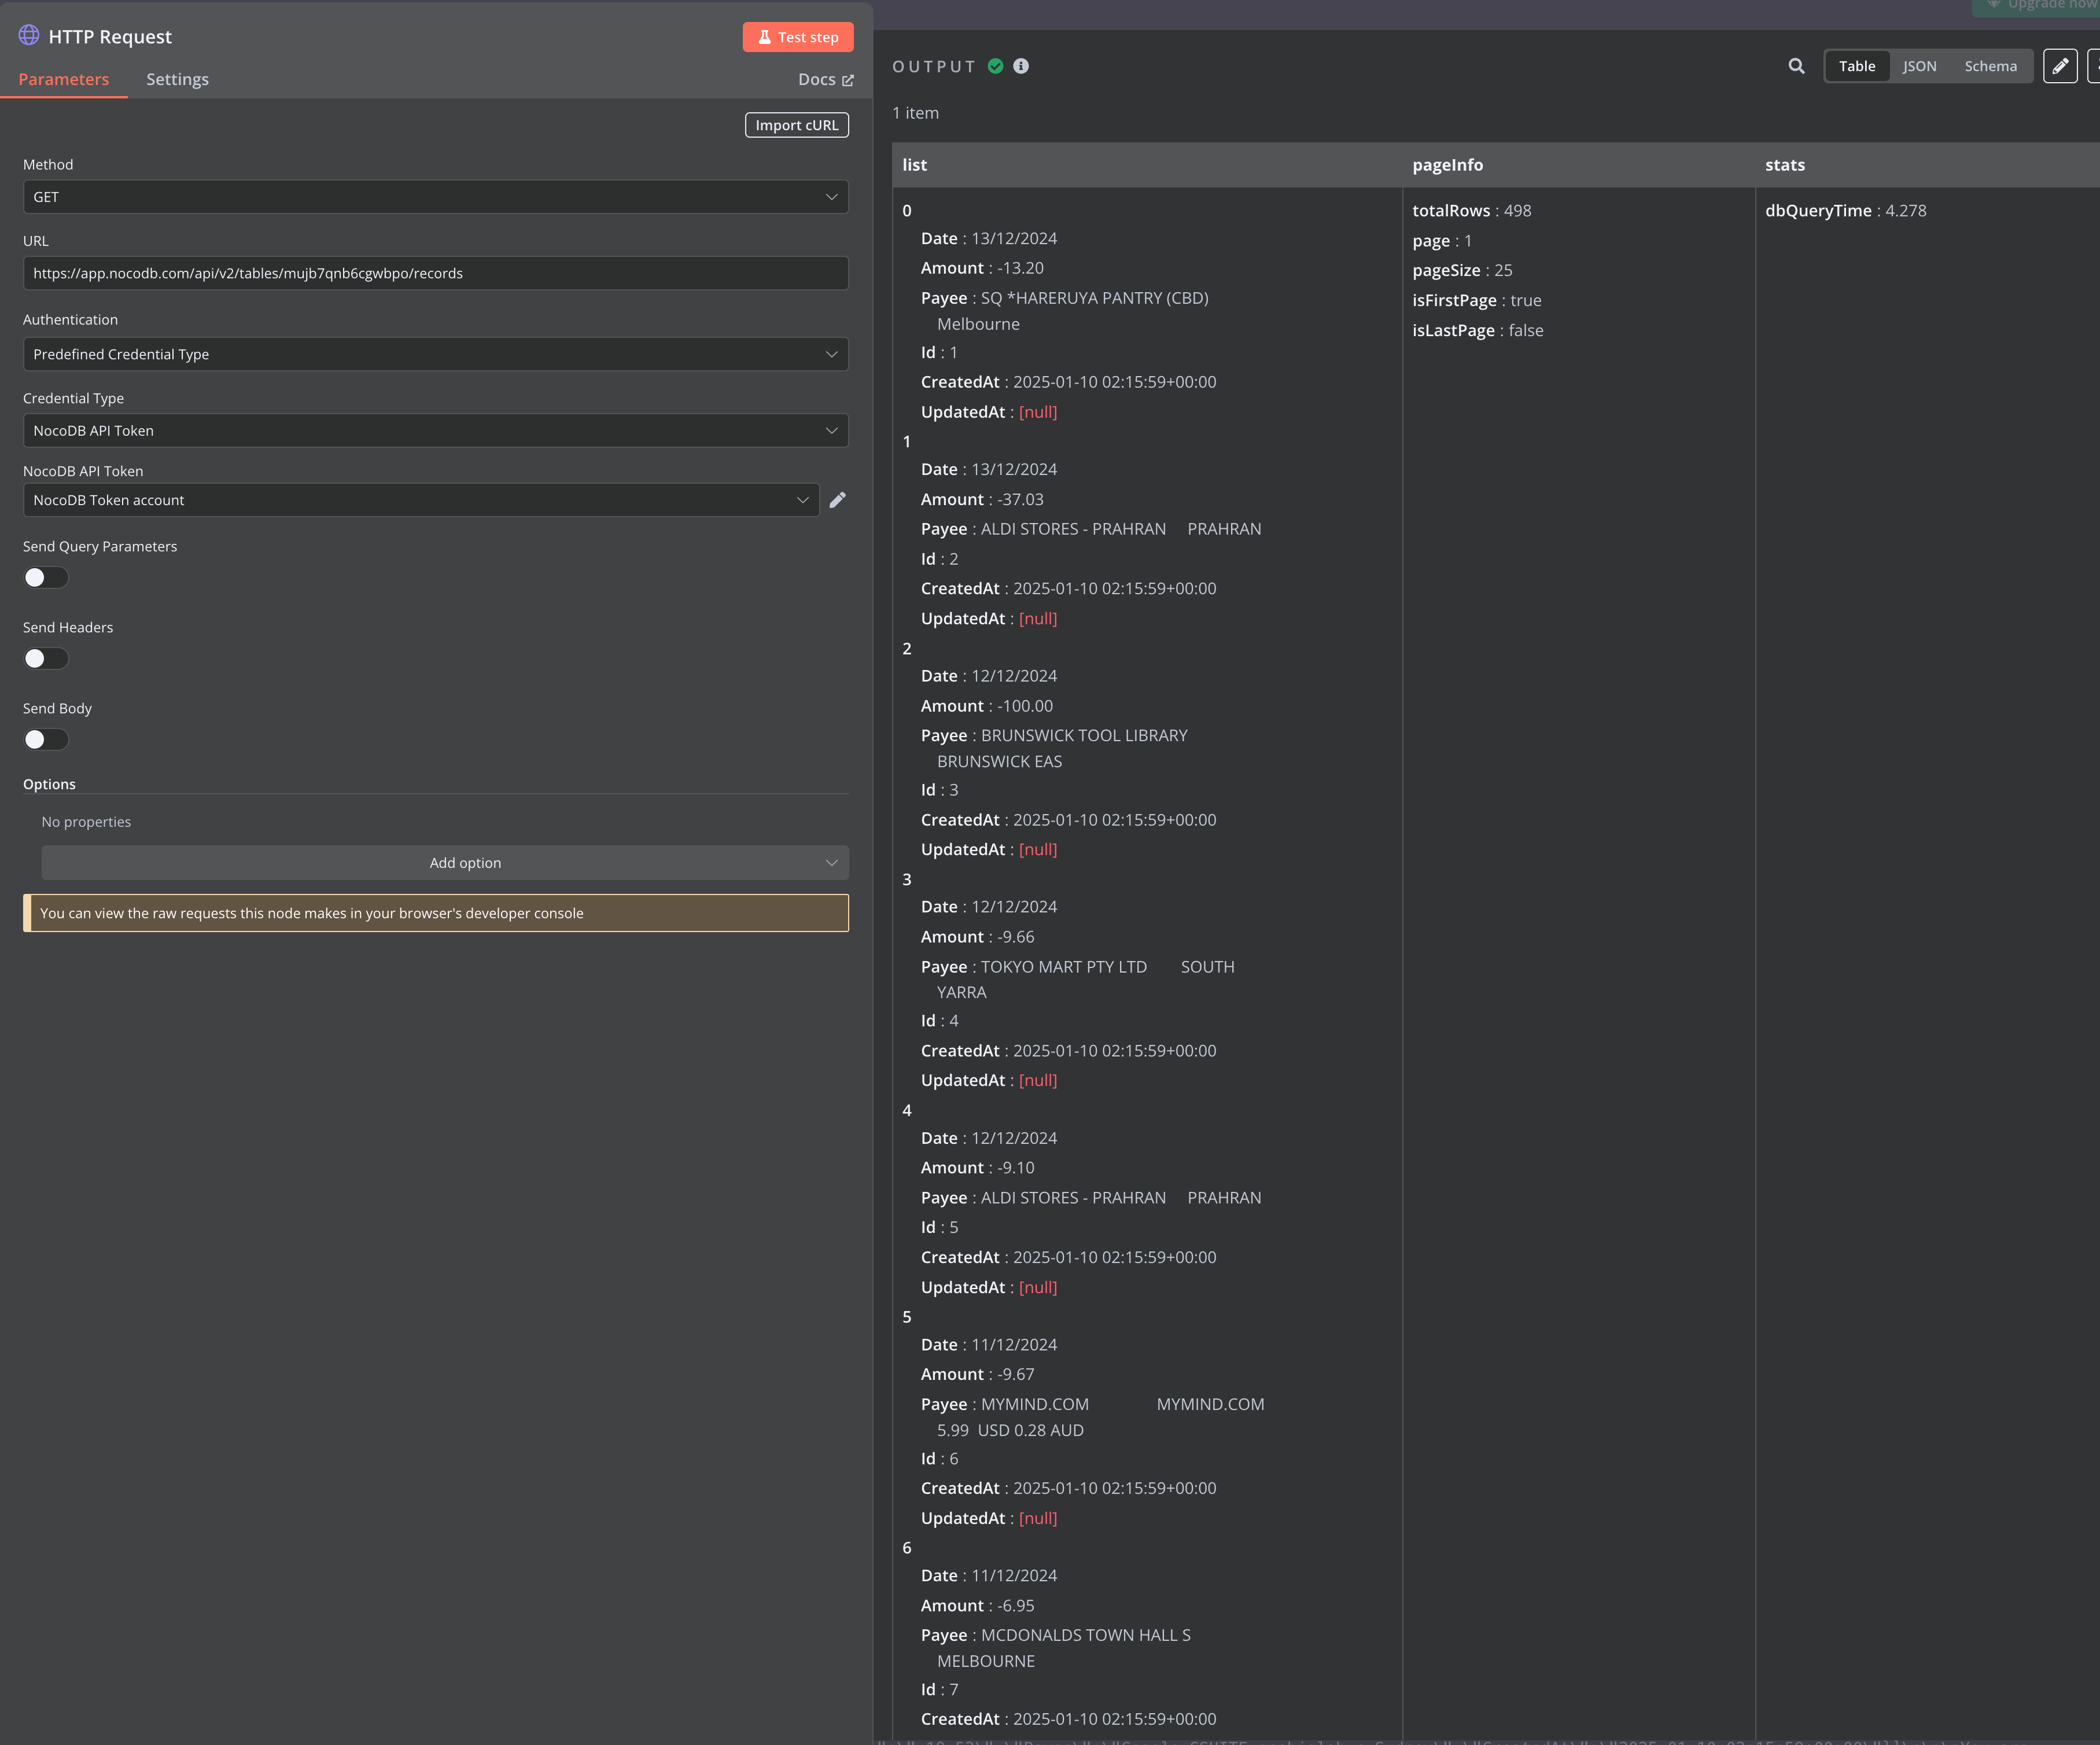
- Querying Data: I used HTTP requests in n8n to pull specific information from the database, such as ‘transactions over $50’ or ‘spending trends by payee’
- Transforming Data: Using JavaScript functions in n8n, I formatted the data for better readability
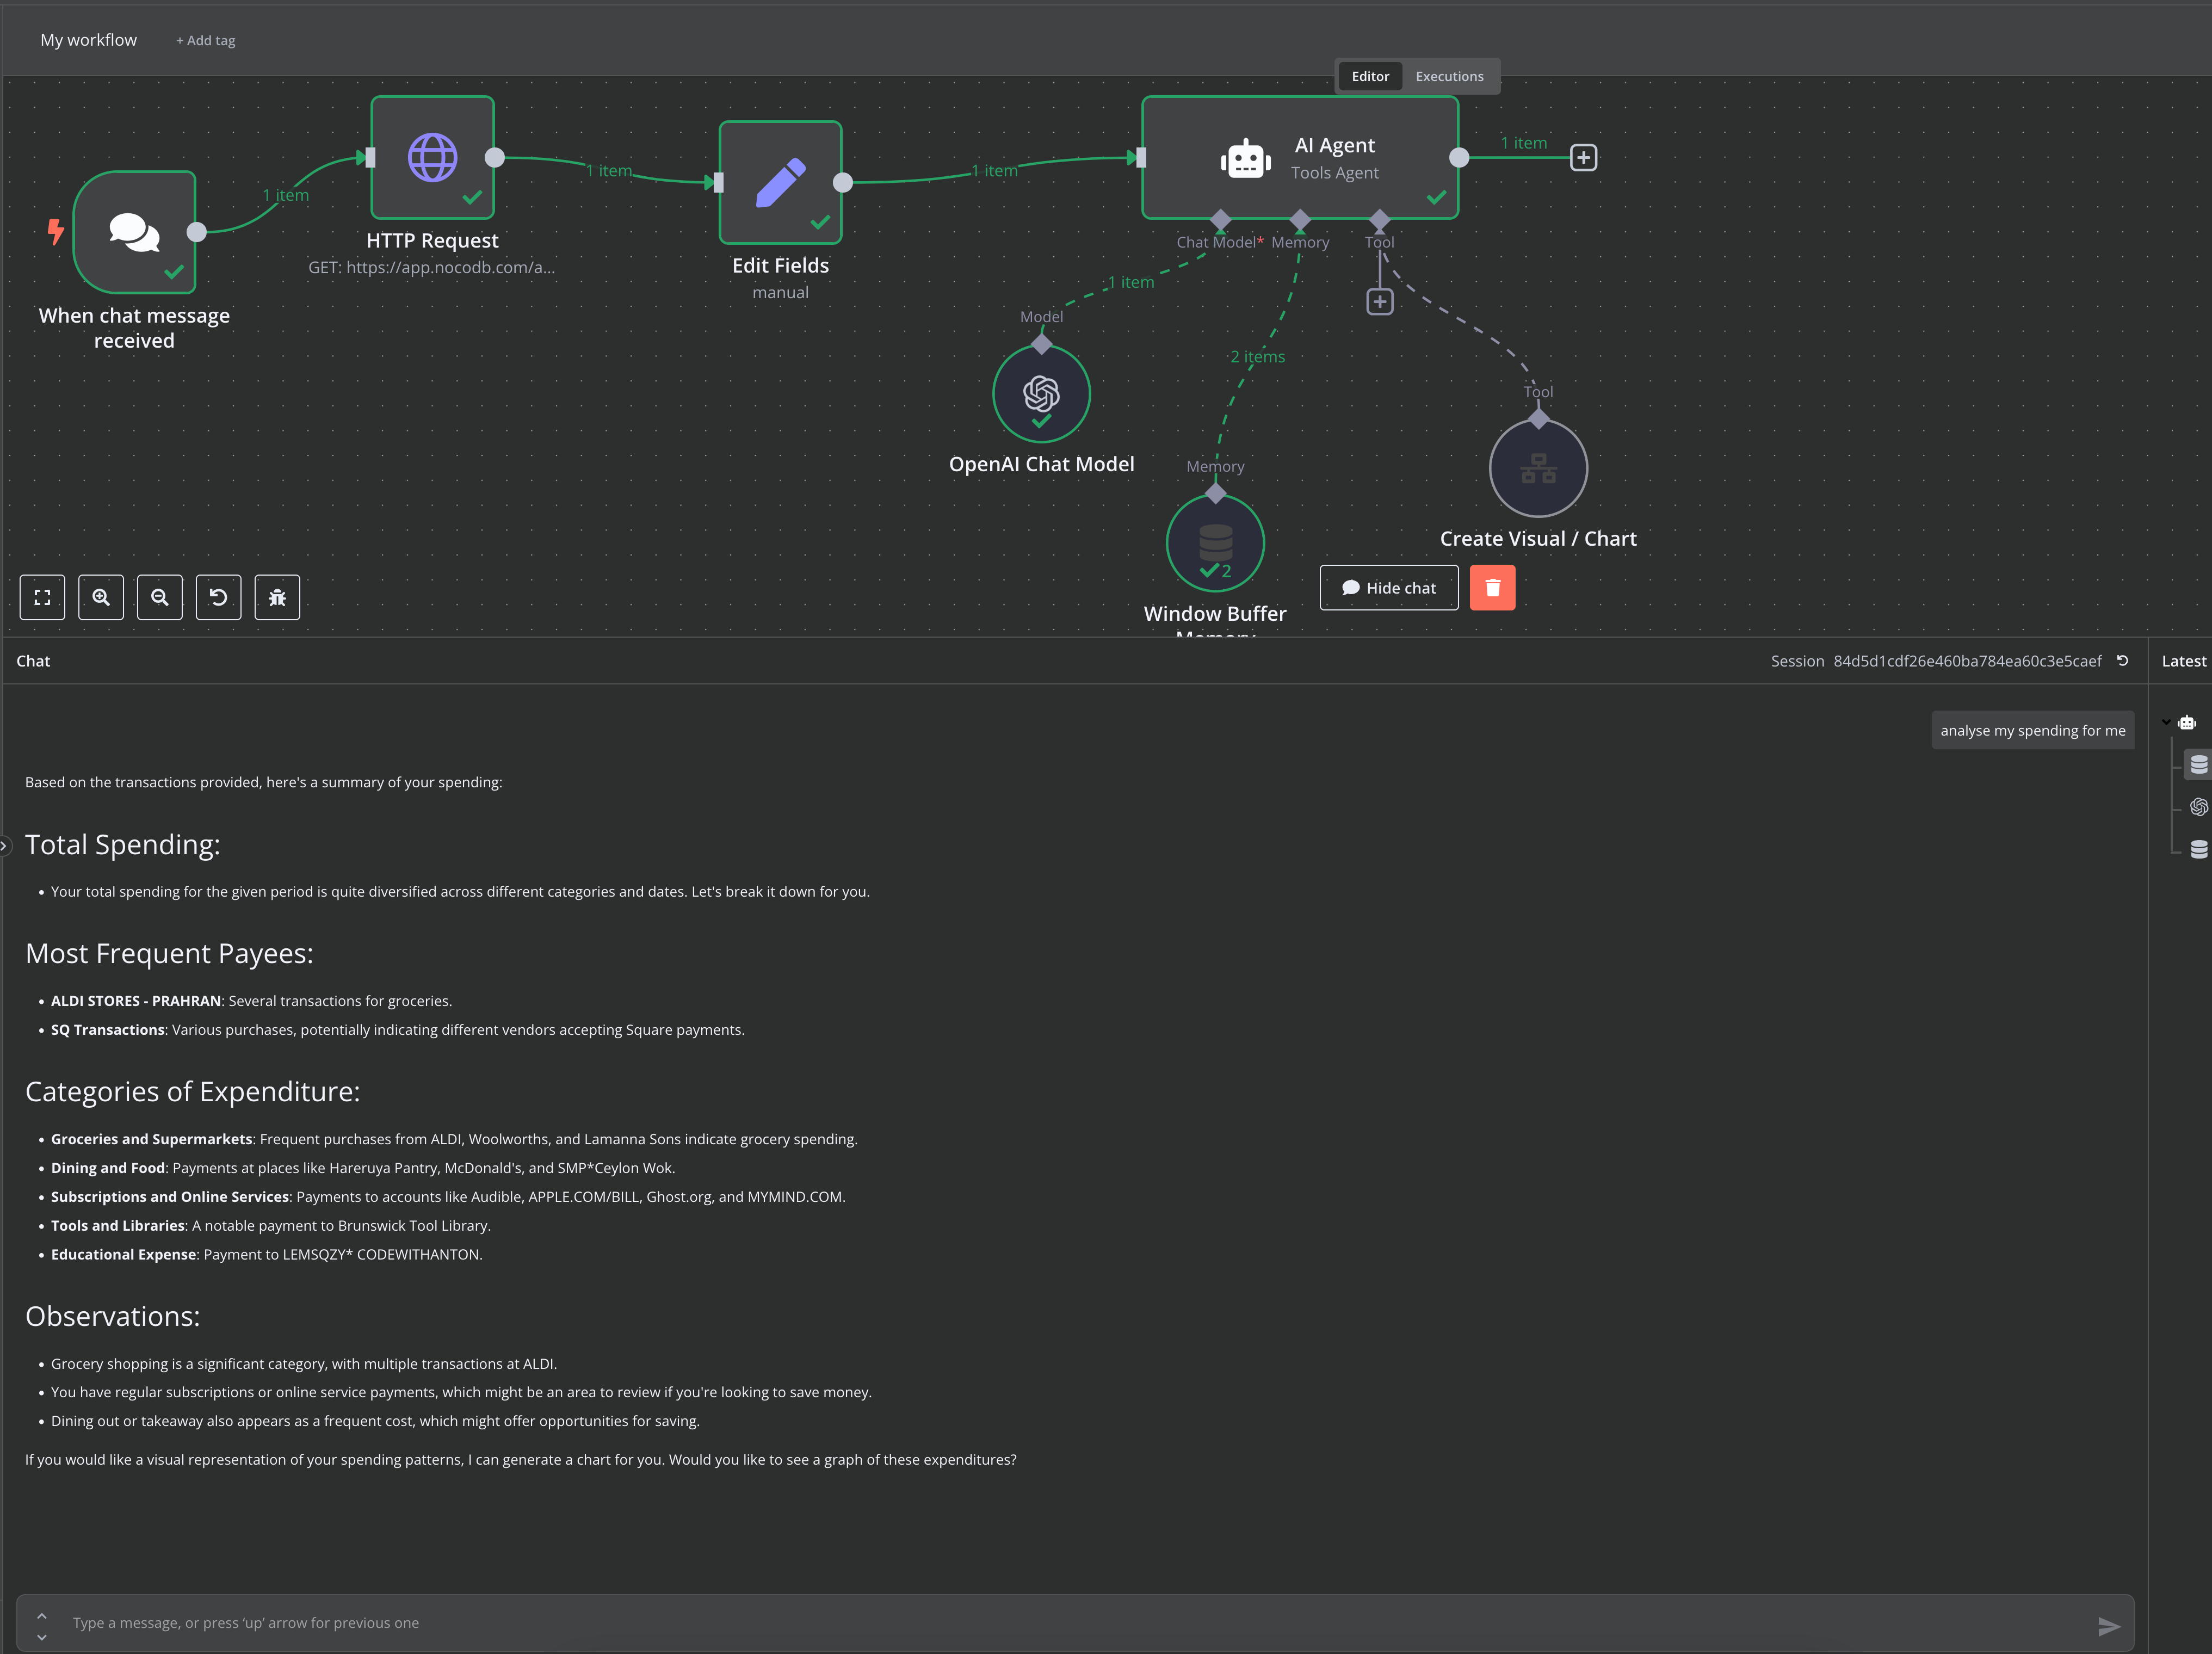
- AI Integration: I connected an OpenAI to answer queries like, “What’s the total amount I spent on groceries last month?“
3. Using AI for Natural-Language Queries
The AI agent acted as a “personal finance assistant.” I provided it with system prompts to help it understand my data:
” You are a personal finance assistant. Your primary role is to help users understand and analyse their financial transactions. You can perform tasks such as:
- Identifying trends in spending habits.
- Highlighting large transactions or unusual patterns.
- Providing summaries of total expenses or spending categories.
- Responding to specific queries, such as the most expensive transaction or the total amount spent at a specific vendor.
Ask the user clarifying questions if the query is ambiguous or requires more detail. Always provide accurate and helpful responses based on the data provided.
Example questions you can answer:
- “What is the total amount spent on 12/12/2024?"
- "List all transactions above $50."
- "What is the most recent transaction?”
Remember to structure your answers clearly and ensure your responses are easy to understand. “
4. Generating Visualisations with QuickChart
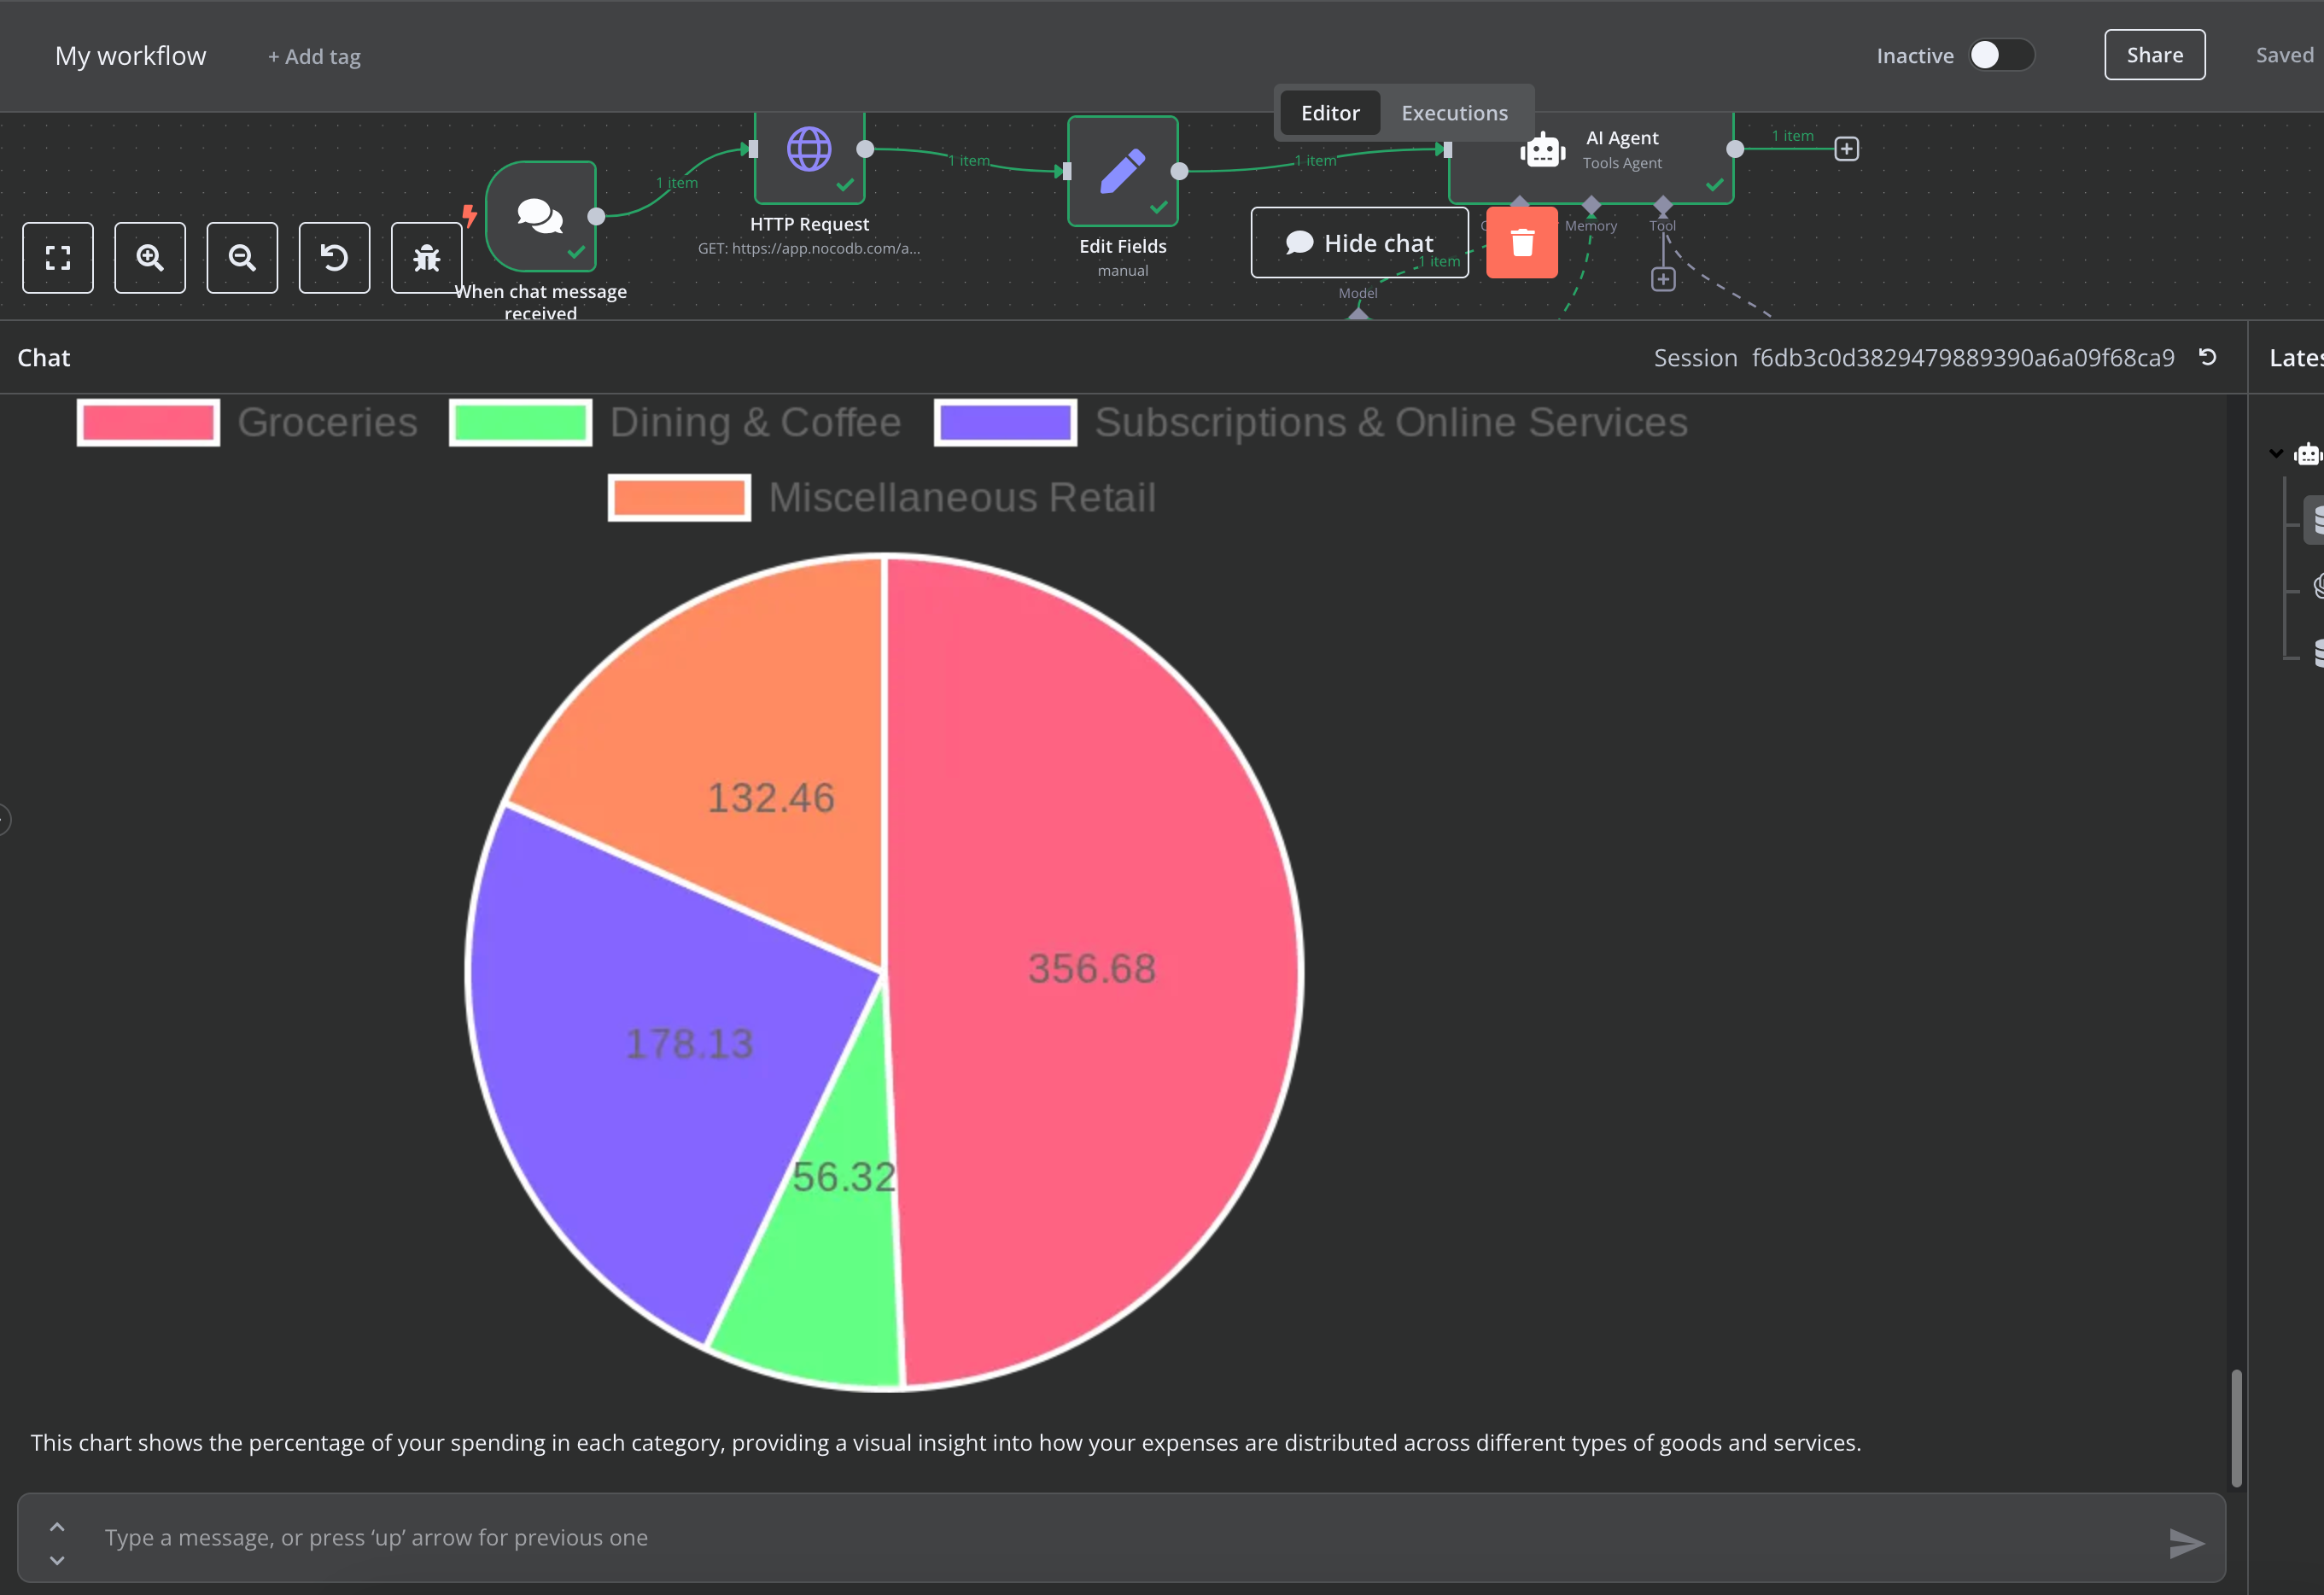
To make the insights more digestible, I integrated QuickChart API. The API allowed me to dynamically generate:
- Pie charts showing spending by category
- Bar charts comparing monthly expenses
- Trend lines tracking spending patterns
Results
By the end of the project, I had a system that could:
- Answer questions like “What’s my total spend at Aldi in December?” or “What’s the most expensive transaction?”
- Generate clean visualisations for quick insights
- Automate recurring financial summaries, like monthly spending reports
Lessons Learned
- No-Code Tools Are Powerful: Tools like n8n and NoCoDB make backend workflows accessible for prototyping and testing concepts.
- AI Elevates the Experience: Adding natural-language processing transformed this from a simple automation to an intuitive, user-friendly system
- Good Design Still Matters: Whether it’s chart layouts or the simplicity of the workflow, UX plays a critical role in making tools useful.
Next Steps
This project started as a personal experiment, but it’s given me ideas for creating lightweight tools to help others manage their finances. I’m thinking of:
- Refining the system further
- Hosting it on a server and working on a frontend with React, and Recharts.
If you’re working on similar projects, or just exploring automation and AI, I’d love to hear about your experiences. Let’s connect and share ideas!